

Key takeaway:
- Relative resilience in Asia: The Hang Seng Index and CSI 300 outperformed most Asian peers during the US–Iran war 2026, declining only -3.3% and -1.1% respectively from 27 Feb to 6 Mar, while markets like the KOSPI and Nikkei 225 suffered deeper losses amid rising oil-driven stagflation fears.
- Policy supports cushioning markets: Investor sentiment in China and Hong Kong improved after signals from the National People’s Congress, where Li Qiang outlined a 4.5%–5% growth target and a stronger focus on boosting domestic consumption and reversing deflation risks.
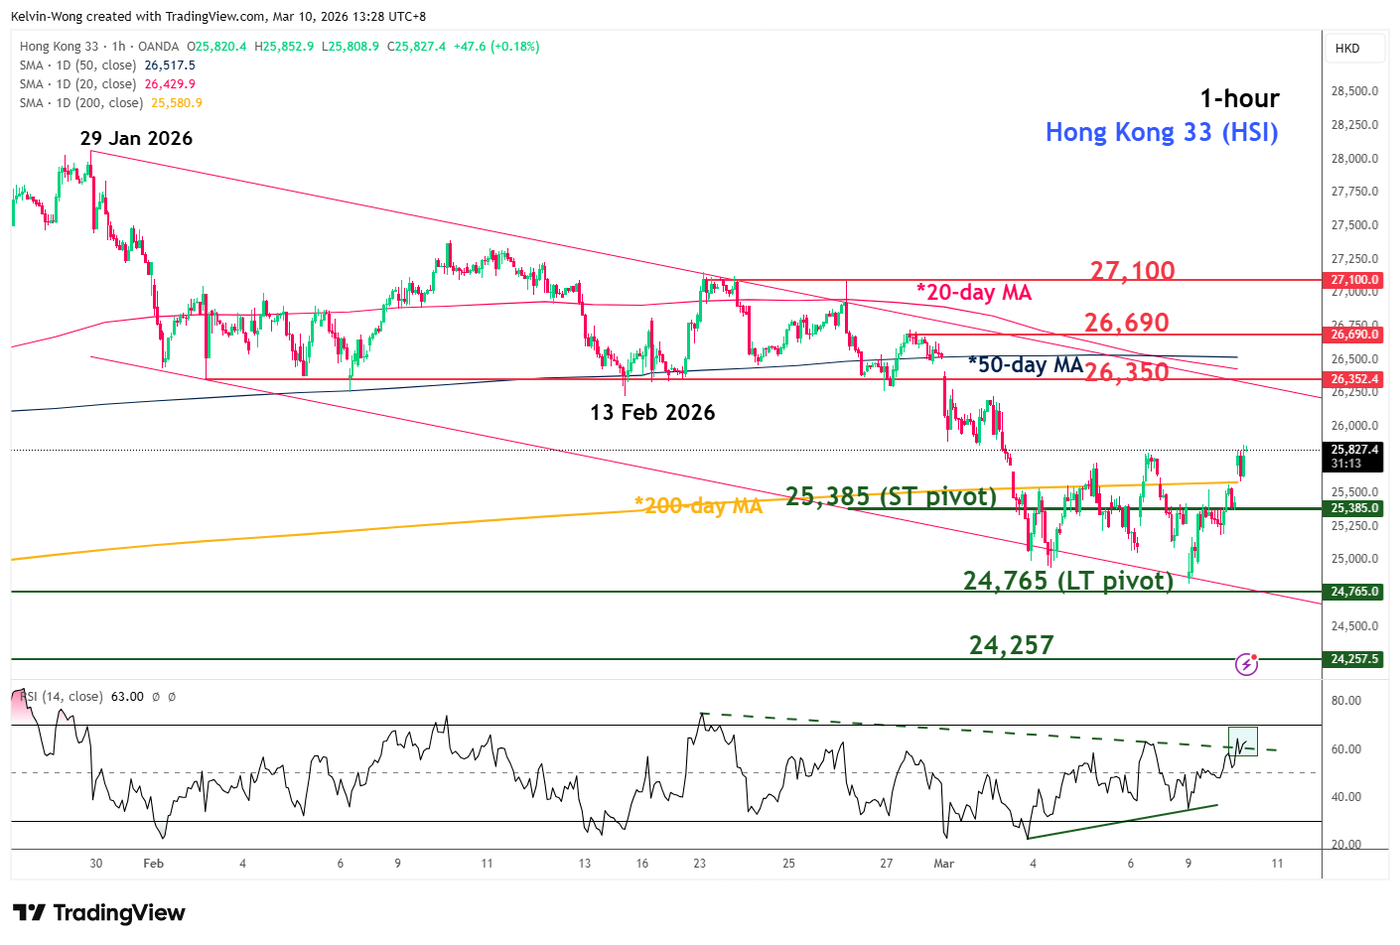
- Key technical levels to watch: The Hang Seng Index rebounded from 24,765 long-term support and reclaimed its 200-day moving average. Bulls need a break above 26,350 to confirm a stronger recovery, while a drop below 25,385 risks a retest of the 24,765 support zone.
The China and Hong Kong benchmark stock indices have outperformed their major Asian Pacific peers among global stock indices in the ongoing 10-day US-Iran war.
Based on a reference period from 27 February 2026 to last Friday, 6 March 2026, where the start of the reference period is one day before the US-Iran war kick-started on 28 February, Hong Kong’s Hang Seng Index and China’s CSI 300 shed -3.3% and -1.1% respectively, while the narrower China A50 was almost unchanged (+0.2%) (see Fig. 1).
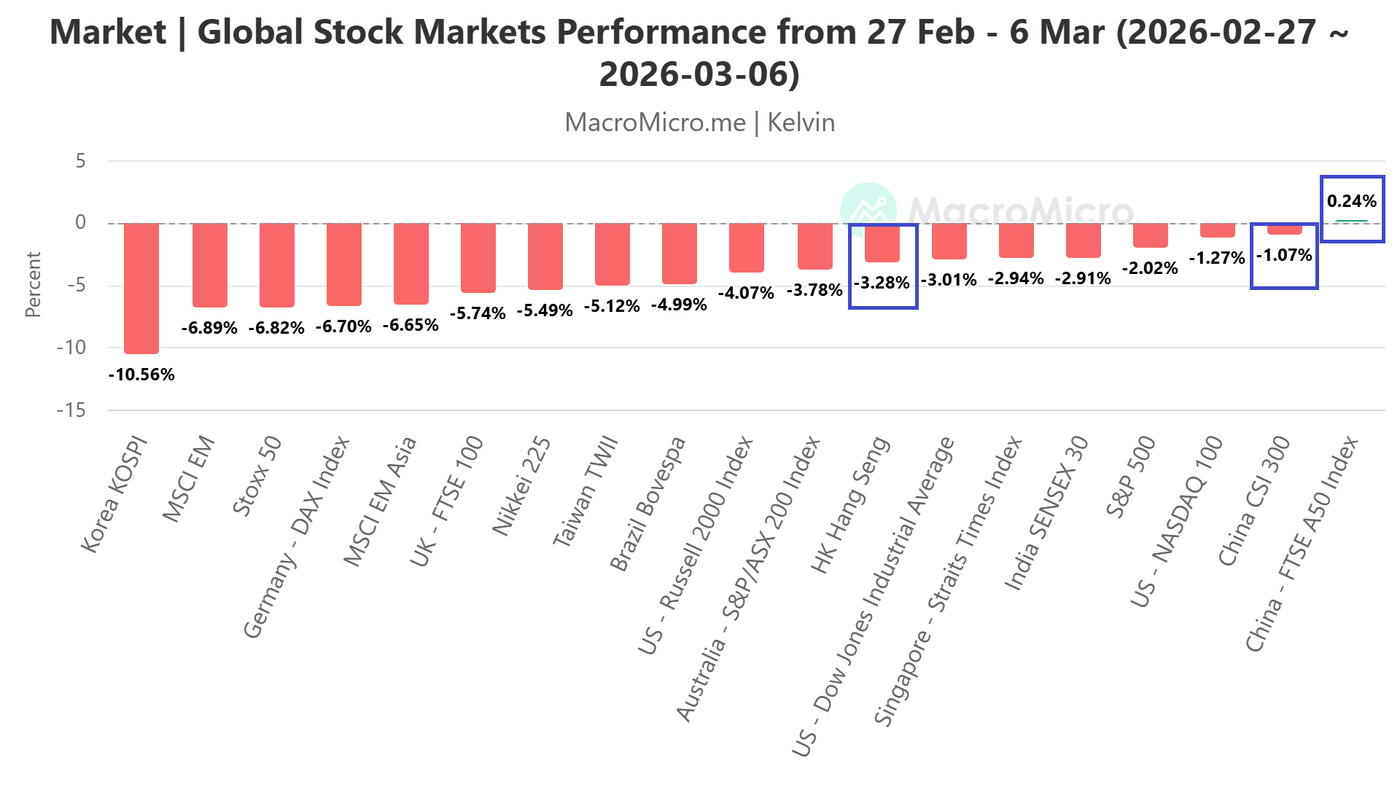
In contrast, South Korea’s KOSPI plummeted 11% (the worst hit), and Japan’s Nikkei 225 declined by 5.5% due to stagflation fears from higher oil prices.
China, Japan, and South Korea are significant net oil importers. The reason why China and Hong Kong stock markets have managed to take a lesser “bearish hit” from the recent upward spiral in oil prices (WTI crude oil staged a weekly gain of 35.6% for the week of 2 March 2026) was due to guidance on China’s next 5-year economic strategy during last week’s key National People’s Congress meeting.
China’s leadership has set a lower economic growth rate target of 4.5%-5% for 2026, the least ambitious to rebalance China’s economy from exports, its current growth driver. In addition, Premier Li Qiang’s speech has made a subtle acknowledgment of deflationary risk towards the economy, and pledged to bring prices back into positive territories, and called for a modest rebound in the inflation trend (versus last year’s vaguer speech to get prices to a reasonable range).
Hence, such statements and new growth targets from China’s leadership suggest that top policymakers are making domestic consumption have a more significant influence in driving China’s economic growth in the next five years.
Let’s now look at the short-term trajectory (1 to 3 days) of the Hang Seng Index from a technical analysis perspective
Hang Seng Index – Rebounded back above the key 200-day moving average
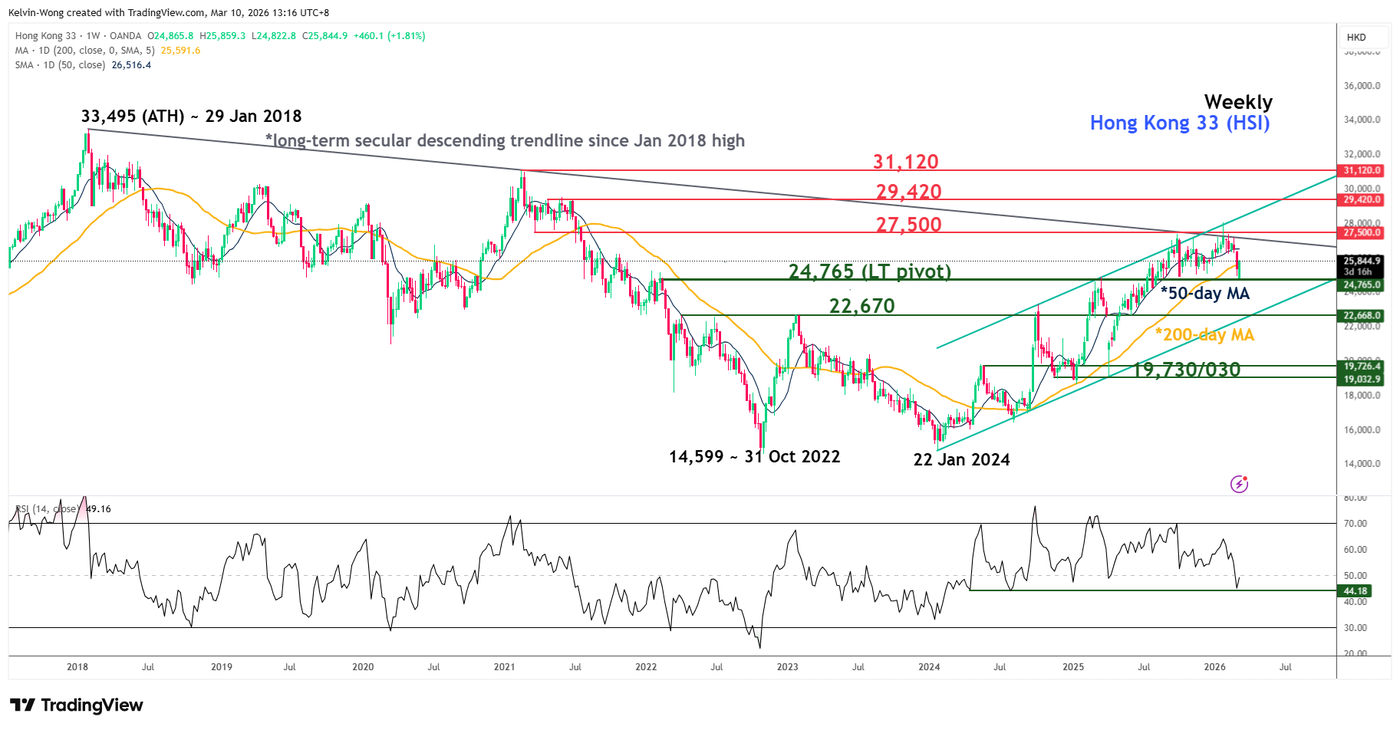
The recent -11% decline seen from the Hong Kong 33 CFD index (a proxy of the Hang Seng Index futures from its 26 January 2026 high to Monday’s 19 March 2026 low of 24,882 has stalled right at the 24,765 long-term pivotal support depicted on its weekly chart (see Fig. 3).
Today, it has staged an intraday rebound of 1.6% and traded back above the 200-day moving average at the time of writing, reinforced by US President Trump’s remarks that signaled a possible end to the current US-Iran war.
Watch the 25,385 key short-pivotal support on the Hong Kong 33 CFD index for a potential minor recovery in the first step to test the 26,350 key intermediate resistance.
A clearance above 26,350 (also the descending channel resistance in place from 29 January 2026 high, and close to the 20-day/50-day moving averages) suggests a bullish exit and a possible start of a new bullish impulsive up move sequence for the next intermediate resistances to come in at 26,690 and 27,100 in the first step (see Fig. 2).
On the other hand, failure to hold and an hourly close below 25,385 invalidates the recovery scenario for a push down to retest the 24,765 key long-term pivotal support.
Key elements to support the bullish bias on the Hang Seng Index
- Today’s positive price reaction has occurred right above the 24,756 key long-term pivotal support and the reintegration back above the 200-day moving average (see Fig. 3).
- The hourly RSI momentum indicator has flashed out a prior bullish divergence condition at its oversold region before it stages the bullish breakout above its descending trendline resistance today (see Fig. 2).
Opinions are the authors’; not necessarily that of OANDA Business Information & Services, Inc. or any of its affiliates, subsidiaries, officers or directors. The provided publication is for informational and educational purposes only.
If you would like to reproduce or redistribute any of the content found on MarketPulse, an award winning forex, commodities and global indices analysis and news site service produced by OANDA Business Information & Services, Inc., please refer to the MarketPulse Terms of Use.
Visit https://www.marketpulse.com/ to find out more about the beat of the global markets.
© 2026 OANDA Business Information & Services Inc.
#Chart #alert #Hang #Seng #Index #recovered #bulls #break