

Key takeaways
- Oil rebound driven by ongoing conflict risks: West Texas Intermediate crude oil has rebounded 32% to around $101 after a sharp prior correction, as the US–Iran war 2026, now in its 17th day, continues to fuel concerns over supply disruptions around the Strait of Hormuz.
- Medium-term bullish bias remains intact: Prediction market data from Polymarket suggests the highest probability of a ceasefire only by June, implying geopolitical risk premiums may persist and support oil’s broader uptrend in the coming months.
- Short-term pullback risk near resistance: Technically, WTI is approaching $105.85 key resistance, where momentum appears to be fading. Failure to break higher could trigger a minor corrective pullback toward $92.60–$88.36, while a breakout above $105.85 would reopen upside toward $116–$119.
This is a follow-up analysis and an update of our prior report, “Chart alert: WTI crude oil resumes uptrend above $88.00 despite historical IEA stockpile release”, published on 12 March 2026.
The price actions of the West Texas (WTI) crude oil have staged an expected bullish reversal after the two-day decline of around 35% from its four-year high printed on last Monday, 9 March 2026, to the 11 March 2026 low.
So far, it has gained by 32% to hit an intraday high of $101.19/barrel in today’s Asia session, 16 March 2026, as the US-Iran war enters the 17th day.
Before we dive into the technical analysis and relevant macro elements of WTI crude oil, here are the latest headlines surrounding the US-Iran conflict in the last 24 hours.
- The key port of Fujairah in the United Arab Emirates was hit again on Monday, the latest in a series of strikes on the site that’s the only outlet for the country that bypasses the Strait of Hormuz.
- Dubai resumes flights after a temporary suspension due to a drone incident.
- US President Donald Trump is “demanding” that other countries help secure transit through the Strait of Hormuz; Australia and Japan said they don’t have plans to send warships to the region now.
- Trump again claimed the US and Iran are in talks and said any deal must include Tehran’s nuclear program. Iran has said it hasn’t asked for negotiations or a ceasefire.
Prediction market’s highest probability of a ceasefire is in June
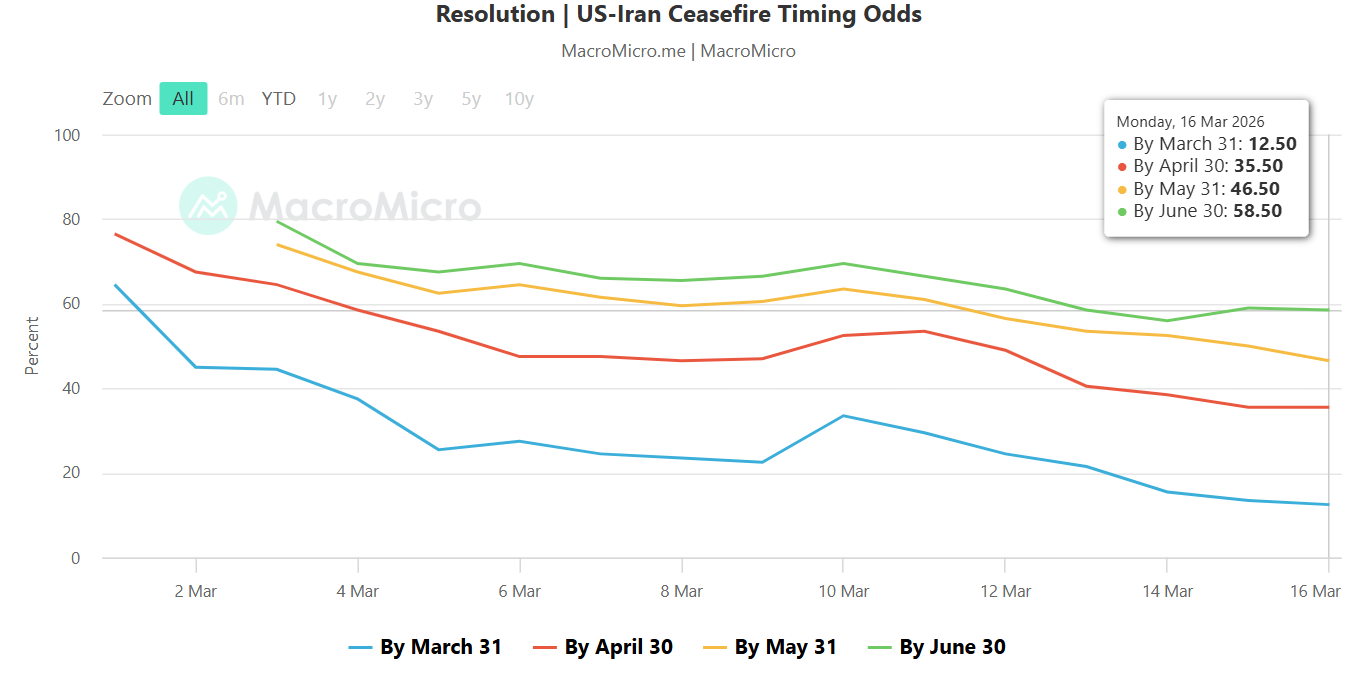
Data from the prediction market platform, Polymarket, where participants trade contracts based on the probability of future events.
The above chart reflects the market-implied probability of an official ceasefire agreement between the US and Iran on various specific dates.
Based on data as of Monday, 16 March 2026, at the time of writing, the lowest odds of 12.5% is being priced by 31 March, with the highest odds of 58.5% by 30 June (see Fig. 1).
Hence, in the next two months, WTI crude oil is likely to maintain its medium-term uptrend phase in place from the 16 December 2025 low.
Let’s now focus on the potential short-term trajectory (1 to 3 days) of WTI crude oil.
WTI Crude Oil – Near-term bullish momentum has eased

At risk of a minor corrective pull-back to retrace a certain portion of the minor uptrend phase from the 11 March 2026 low for the West Texas Oil CFD index (a proxy of the WTI crude oil futures).
Watch the $105.85 key short-term pivotal resistance for a potential push down towards the next intermediate supports at $92.60 and $88.36 (also the minor ascending trendline support from 26 February 2026 low) (see Fig. 2).
On the other hand, a clearance and hourly closing above $105.85 invalidates the near-term bearish scenario for a squeeze up to retest $116.56/119.54 before targeting the next resistance at 124.40.
Key elements to support the near-term bearish bias on WTI crude
- The hourly RSI momentum indicator has found resistance at around the 67 level, which indicates a potential easing of short-term bullish momentum.
- Based on the Elliot Wave/fractal analysis, the short-term price structure of the West Texas Oil CFD index has traced out a potential five-wave minor uptrend impulsive up move cycle labelled as i, ii, iii, iv, v.
- The current price action is likely considered as the bullish impulsive wave v movement with its potential terminal level at $105.85 (0.618 Fibonacci extension) to complete the minor five-wave uptrend impulsive up move cycle.
Opinions are the authors’; not necessarily that of OANDA Business Information & Services, Inc. or any of its affiliates, subsidiaries, officers or directors. The provided publication is for informational and educational purposes only.
If you would like to reproduce or redistribute any of the content found on MarketPulse, an award winning forex, commodities and global indices analysis and news site service produced by OANDA Business Information & Services, Inc., please refer to the MarketPulse Terms of Use.
Visit https://www.marketpulse.com/ to find out more about the beat of the global markets.
© 2026 OANDA Business Information & Services Inc.
#Chart #alert #WTI #crude #oil #rally #reached #risk #minor #setback