

Ongoing War flows have been very different from what the trading and investing world has been accustomed to.
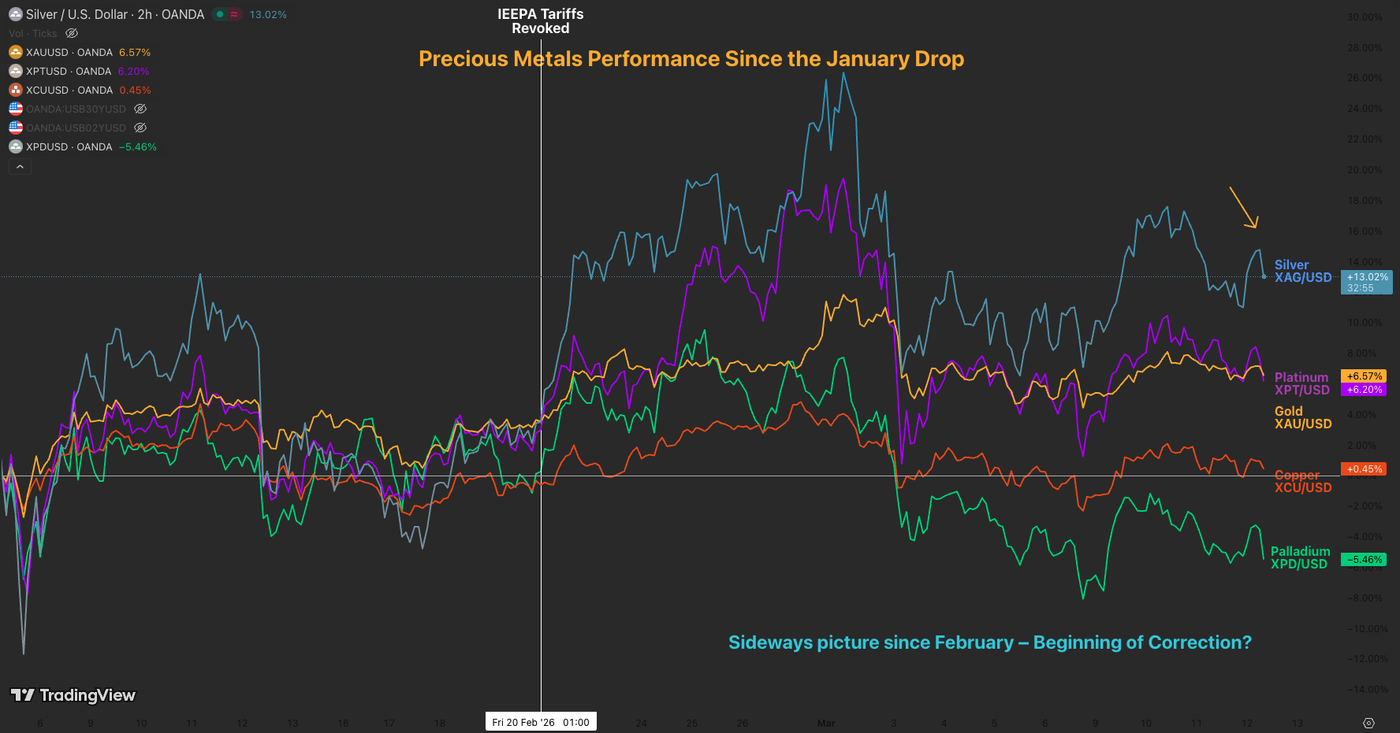
Safe-haven assets like Metals (particularly Gold and Silver) and Bonds have not seen any consistent demand. At the same time, Stock Markets and risk sentiment in general have remained very solid despite stagflationary fears.
Only Oil and, consequently, the Petrodollar, have managed to grab consistent attention and generate persistent trends.
One question remains for Metals aficionados – Where is the flight to demand towards them?
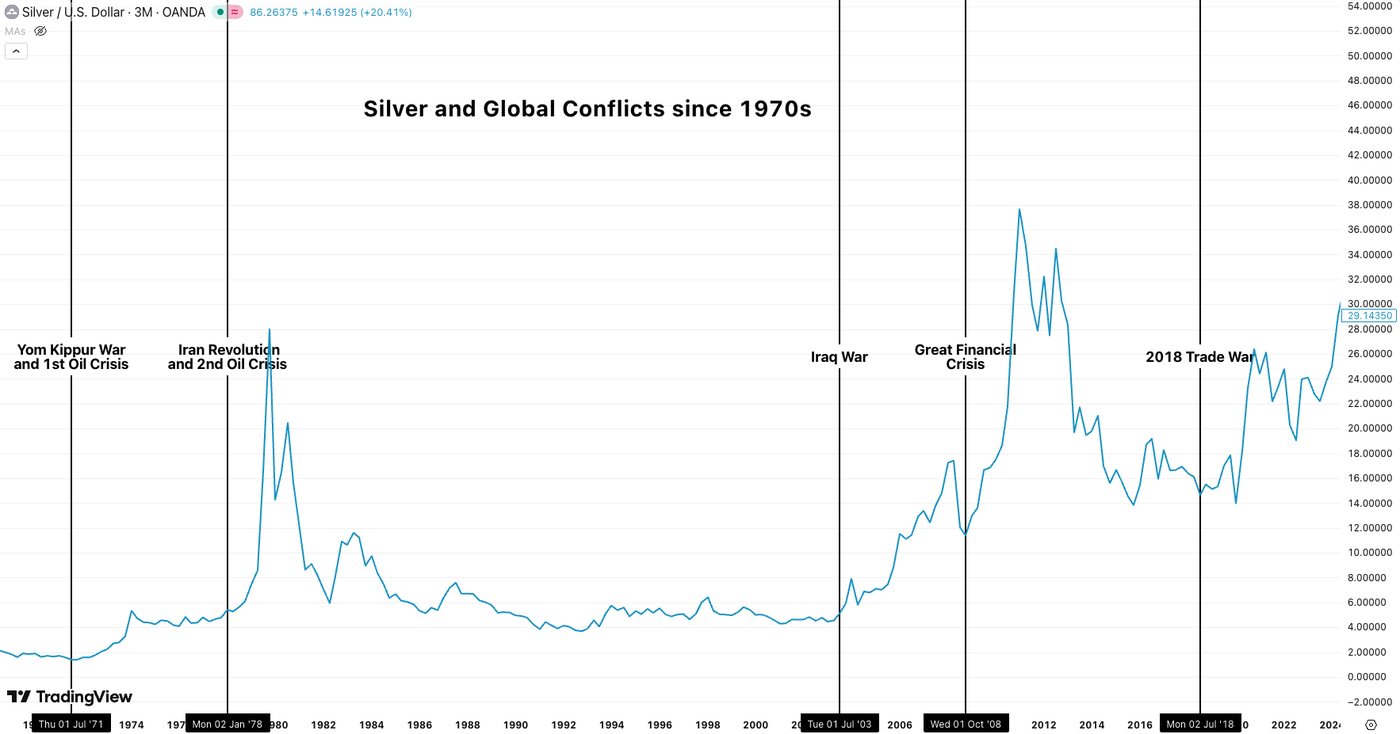
Their previous run higher throughout their borderline insane performance from mid-2025 to January 2026 could explain exhausted buyers.
When people get heavily positioned in an asset class, buyers run out of bullets (to buy more), supply increases to capture the higher values and it distorts the previous stock-shortage that led to previous price increases.this heavy positioning was outlined in the recent Bank of America survey.
As a matter of fact, the ongoing War could be what is holding Silver and Metals prices at current levels – After the Late January price tumble, their correction suddenly stalled at a similar time that WTI began to rally and the ongoing US-Iran War began to enter Market discussions.
So that could open the door for a large correction in the event of a war resolution!
Still, the global economy is largely different than it was just a few years ago, with the second round of Trump Trade Wars, de-globalization and persistent rise of new conflicts.
It wouldn’t be surprising to never see $20 Silver prices again, but $50 is not completely out of the picture – In the meantime, traders can profit from the hesitant price action by playing ongoing consolidation around the asset classes.
We will dive into a Silver multi-timeframe analysis to spot the current range in the Metal and explore potential breakout levels. Let’s get right into it.
Read More:
- Markets resist and volatility fades – North American Mid-Week Market Update
- Bitcoin’s (BTC/USD) Price Outlook: Why Bitcoin’s recovery still lacks the ingredients for a decisive bullish turn
- Chart alert: WTI crude oil resumes uptrend above $88.00 despite historical IEA stockpile release
Silver (XAG/USD) Multi-timeframe Technical Analysis
Daily Chart
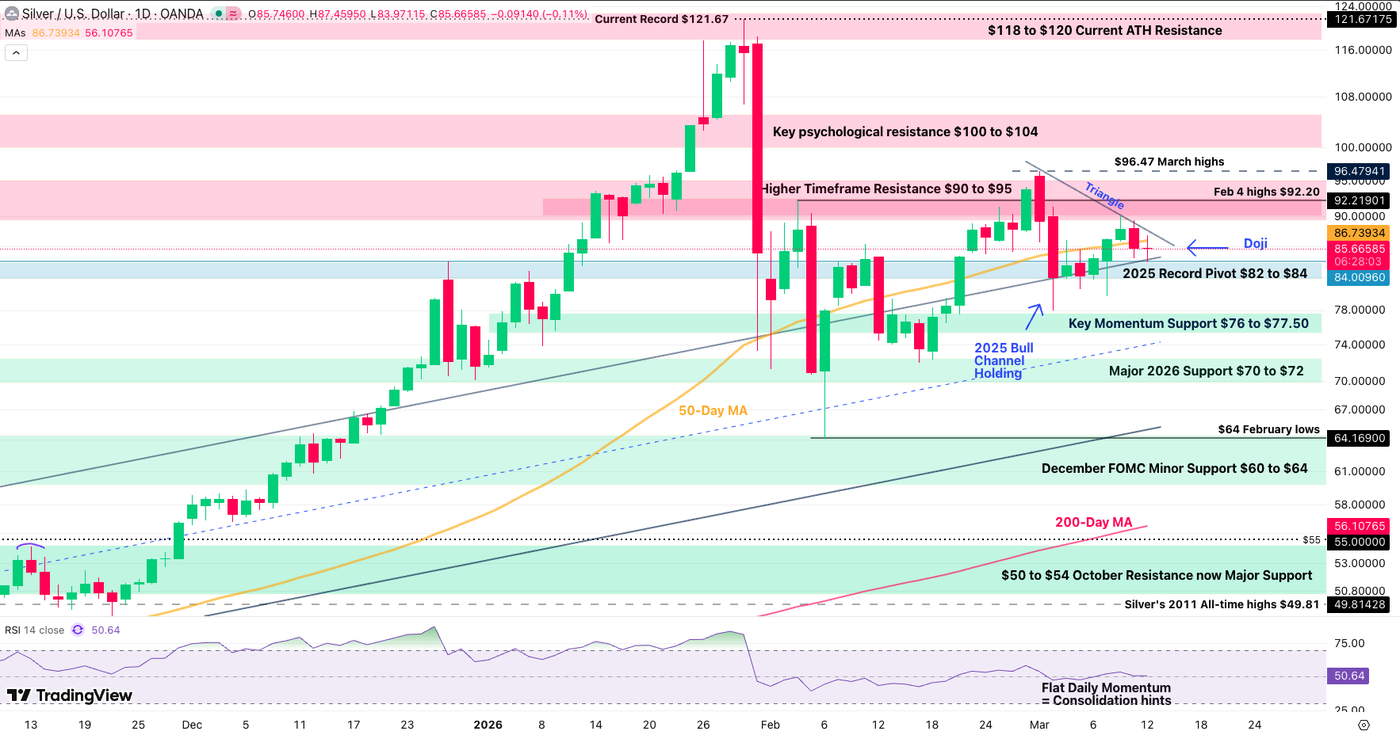
Silver has now remained in a $80 to $96 range since the end of February, holding the top of its 2025 (broken) upward Channel as Support – A major technical indicator to track bull strength.
RSI momentum has died down in the higher timeframe, indicating current equilibrium around current prices – this confirms after the failed breakdown in early March and consequent failed breakout.
This provides quality indications for a rangebound price action.
Let’s take a closer look
4H Chart and Technical Levels
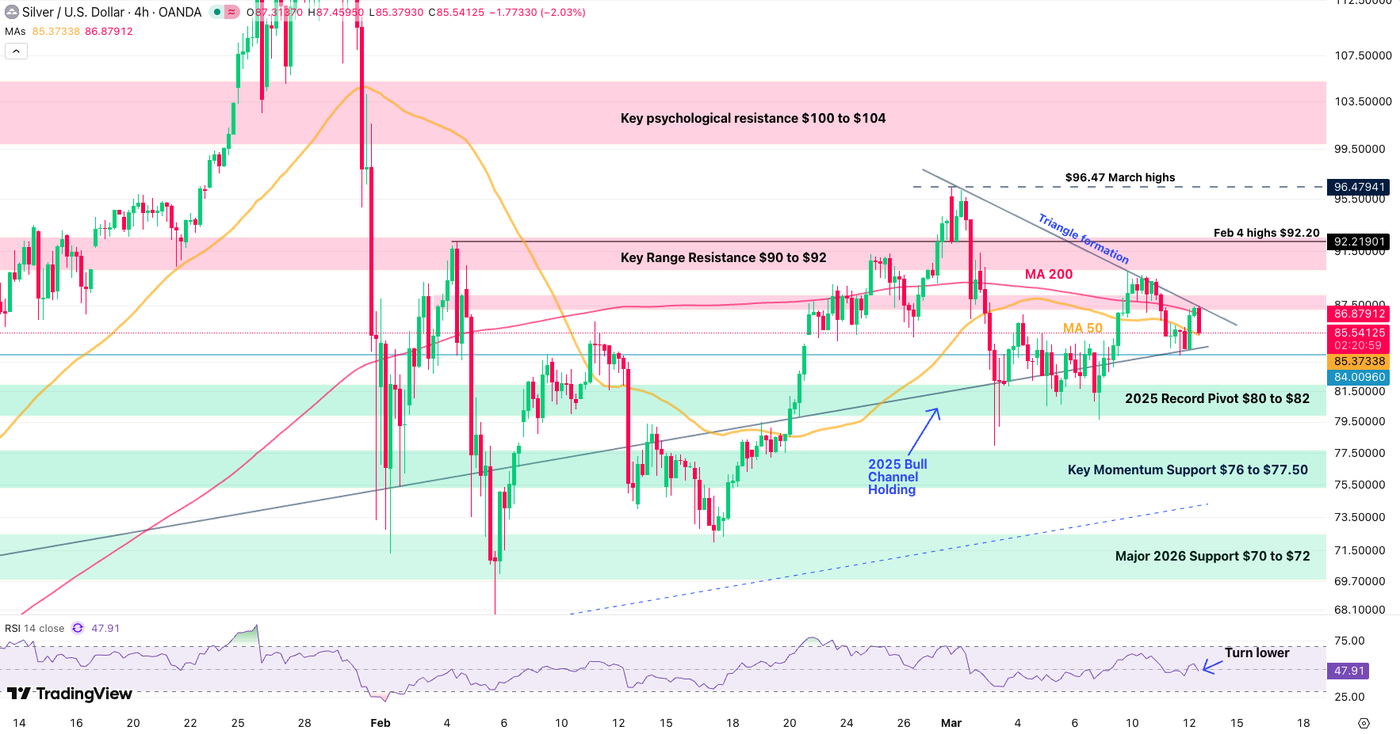
Looking closer, bears are entering at the highs of the triangle formation, pointing to interesting tests coming ahead:
- Breaking the $84.50 support trendline (from the 2025 Channel) would hint at the $80 Support
- Holding the support would confirm the range towards a $90 rebound
- Breaking it however could lead to retesting the $70 2026 Support
- Rebounding on the Support trendline could lead to an imminent rebound towards the $90 to $92 Resistance (less probable with current RSI conditions)
Levels to watch for Silver (XAG) trading:
Resistance Levels:
- $87 Session highs (Mini-Resistance)
- Key Range Resistance $90 to $92
- Higher Timeframe Major Resistance $90 to $95
- $96.47 March highs
Support Levels:
- Triangle Support $84.50 (short-term bearish below)
- 2025 Record Pivot $80 to $82
- Key Momentum Support $76 to $77.50
- Major 2026 Support $70 to $72
- December FOMC Minor Support $60 to $64 (Feb Lows)
- $50 to $54 Major Support
1H Chart
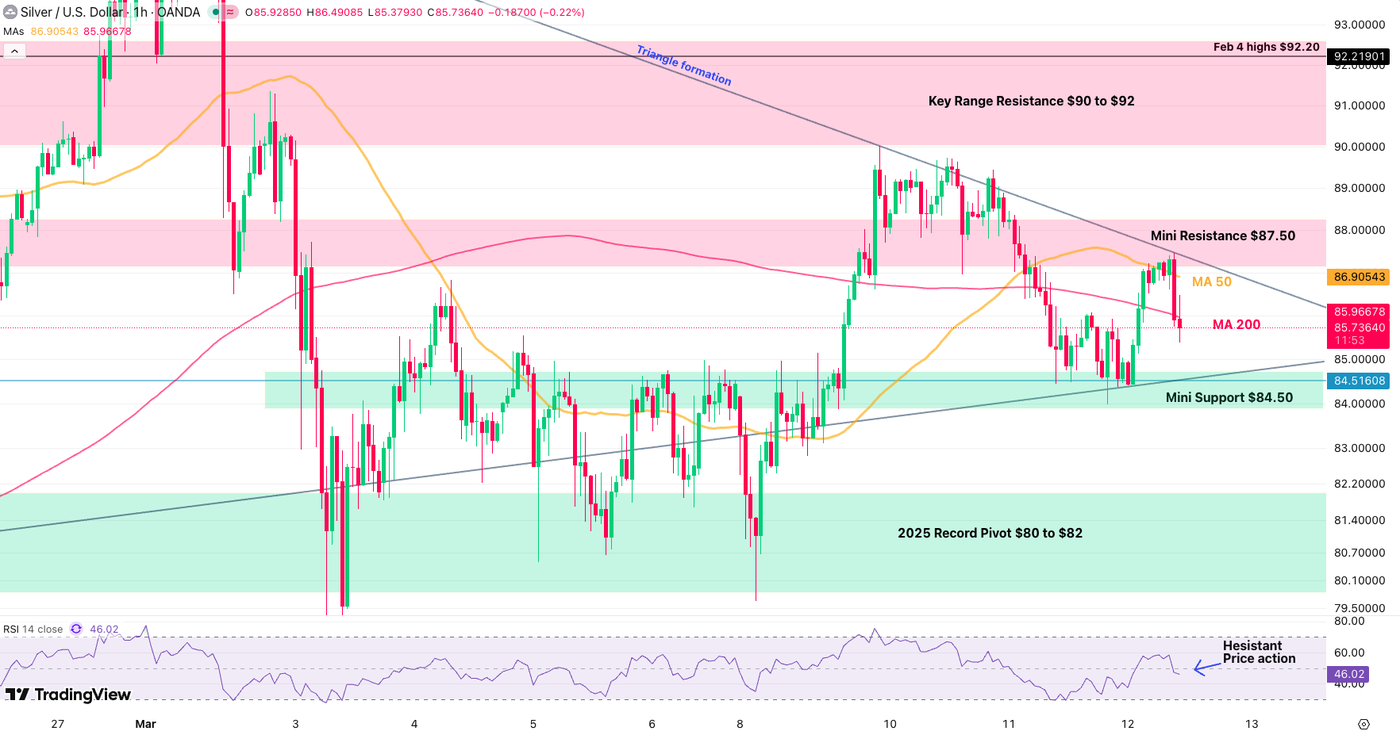
With the hesitation also spreading to the shorter timeframes, traders could await for either:
- A break below the mini-support $84.50 to play a breakdown to $80
- Ongoing selling should take the action there soon!
- A break above the daily $87.50 to play a breakout to $92
Safe Trades!
Follow Elior on Twitter/X for Additional Market News, interactions and Insights @EliorManier
Opinions are the authors’; not necessarily that of OANDA Business Information & Services, Inc. or any of its affiliates, subsidiaries, officers or directors. The provided publication is for informational and educational purposes only.
If you would like to reproduce or redistribute any of the content found on MarketPulse, an award winning forex, commodities and global indices analysis and news site service produced by OANDA Business Information & Services, Inc., please refer to the MarketPulse Terms of Use.
Visit https://www.marketpulse.com/ to find out more about the beat of the global markets.
© 2026 OANDA Business Information & Services Inc.
#Silver #XAGUSD #rejects #triangle #formation #Iran #War #Breakout #scenarios