

Despite yesterday’s more optimistic US CPI report, Markets are now focusing on a bleaker inflationary picture ahead.
A major theme in Markets is the progressive repricing for a more persistent and damaging US-Iran-Israel war, which would have a long-lasting consequences on Oil prices.
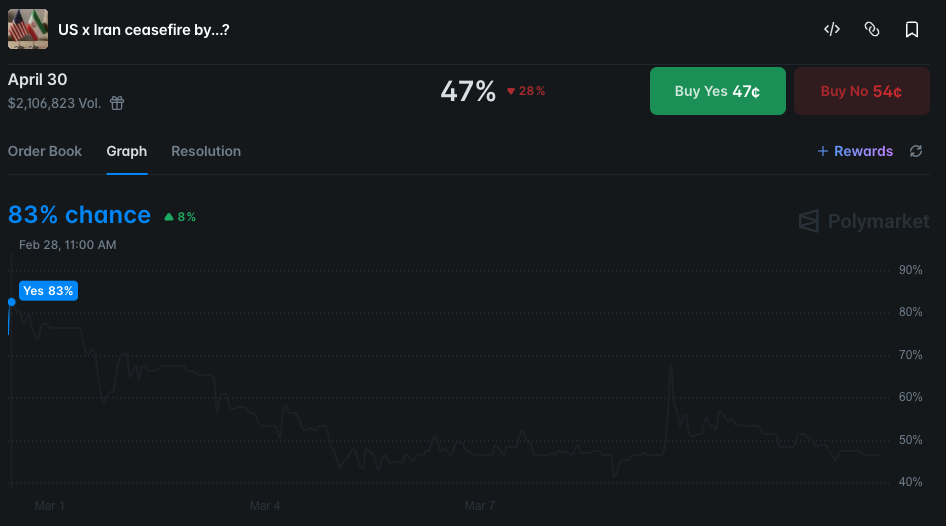
As you can see from the Polymarket odds, the odds for a 5- to 6-week conflict fell from 80% to the current 47%, adding to the (justified) fears of a damaging long-war.
With the Iranian regime holding out stronger than expected, nominating a new leader in Mojtaba Khamenei and continuing its attacks on neighboring countries, it seems that it would either require more force or a new plan to really materialize the conflict into the desired regime change outcome.
Participants and the general media are now roasting the Trump Administration for its lack of Exit plans. To me, this could be a strategy to create doubt, as we are “only” on the 13th day of the conflict, but people’s skepticism regarding Trump’s temerity is justified.
Even his prior advisors warned of such, warning of a “self-afflicted wound” to the US Economy as Oil rallies back to $95.
For those who haven’t looked back yet, the consecutive Oil Crises in the 1970s were the prelude to the infamous Stagflation era, and the Market never jokes around with such economic trends.
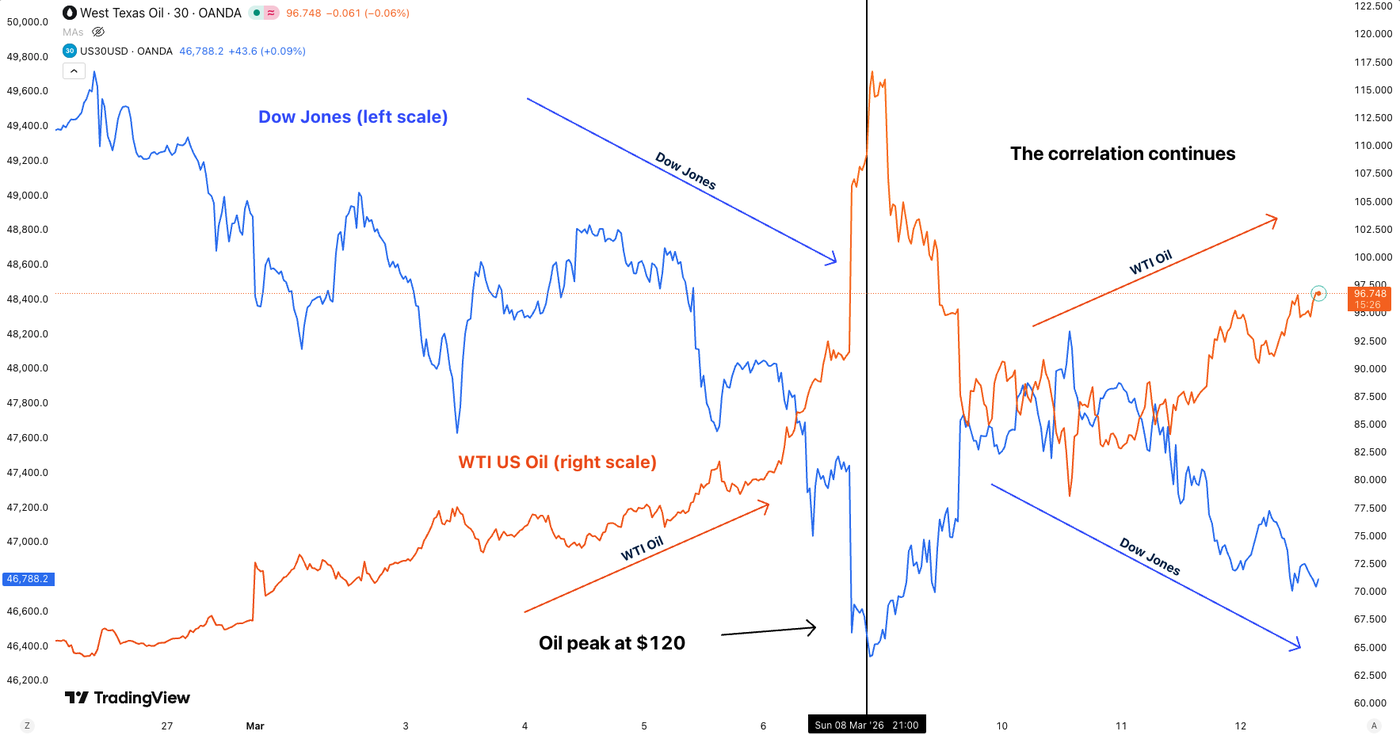
If anybody is enjoying this at least, it’s the Dollar bulls, as the Petrodollar has been fuming higher since the beginning of the Conflict.
Rate traders have now priced out around 40 bps of rate cut pricing since the beginning of the conflict, with Rate cut odds towards end 2026 only around 23 bps.
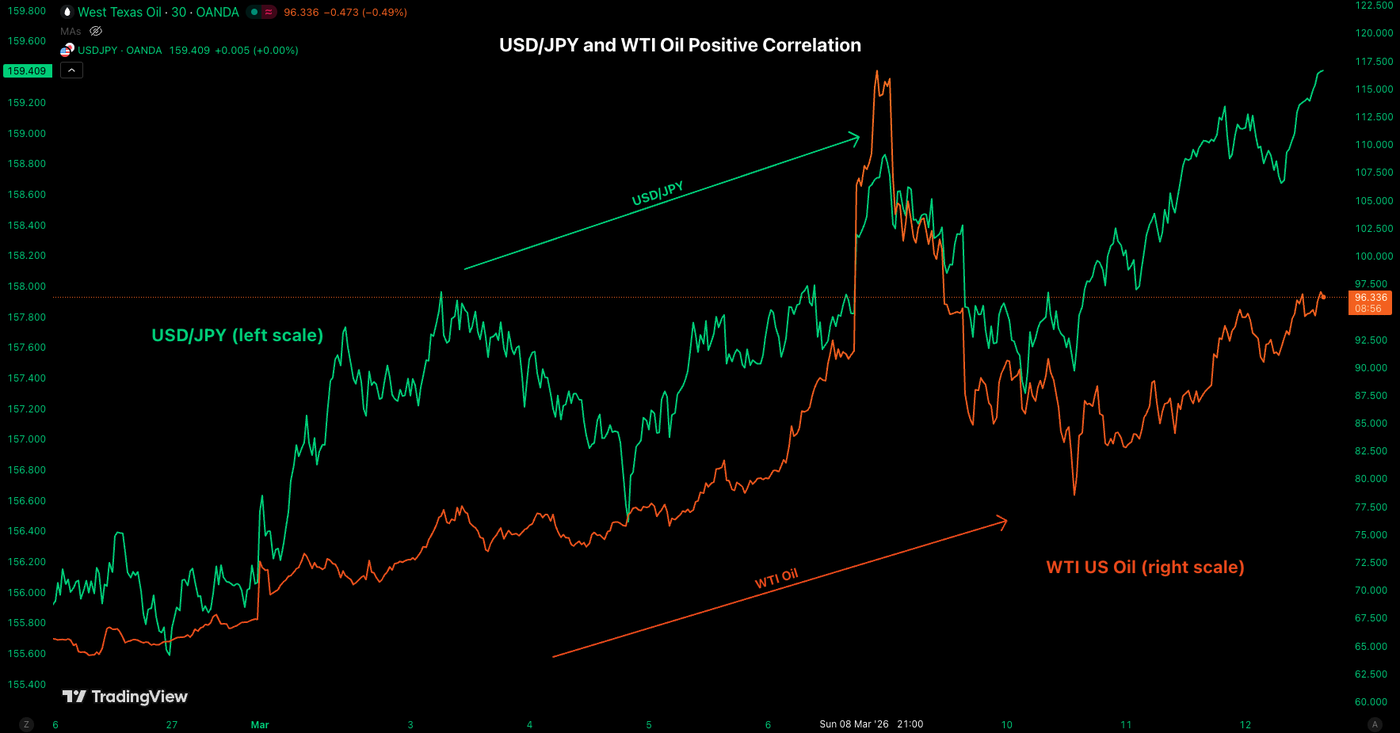
Subject to an almost 1 to 1 correlation with Oil since early March, the Greenback has kept outperforming major Forex currencies, in particular the subject of this afternoon’s FX outlook, the Yen.
We will dive into a two-timeframe outlook for USD/JPY as the pair comes close to the 160.00 barrier.
An intervention could be near!
Read More:
- Markets resist and volatility fades – North American Mid-Week Market Update
- Silver (XAG/USD) rejects triangle formation from Iran War – Breakout scenarios
- Dow Jones tumbles 600 points on Strait of Hormuz tensions and private credit jitters, support at 46660 is key
USD/JPY Daily Chart
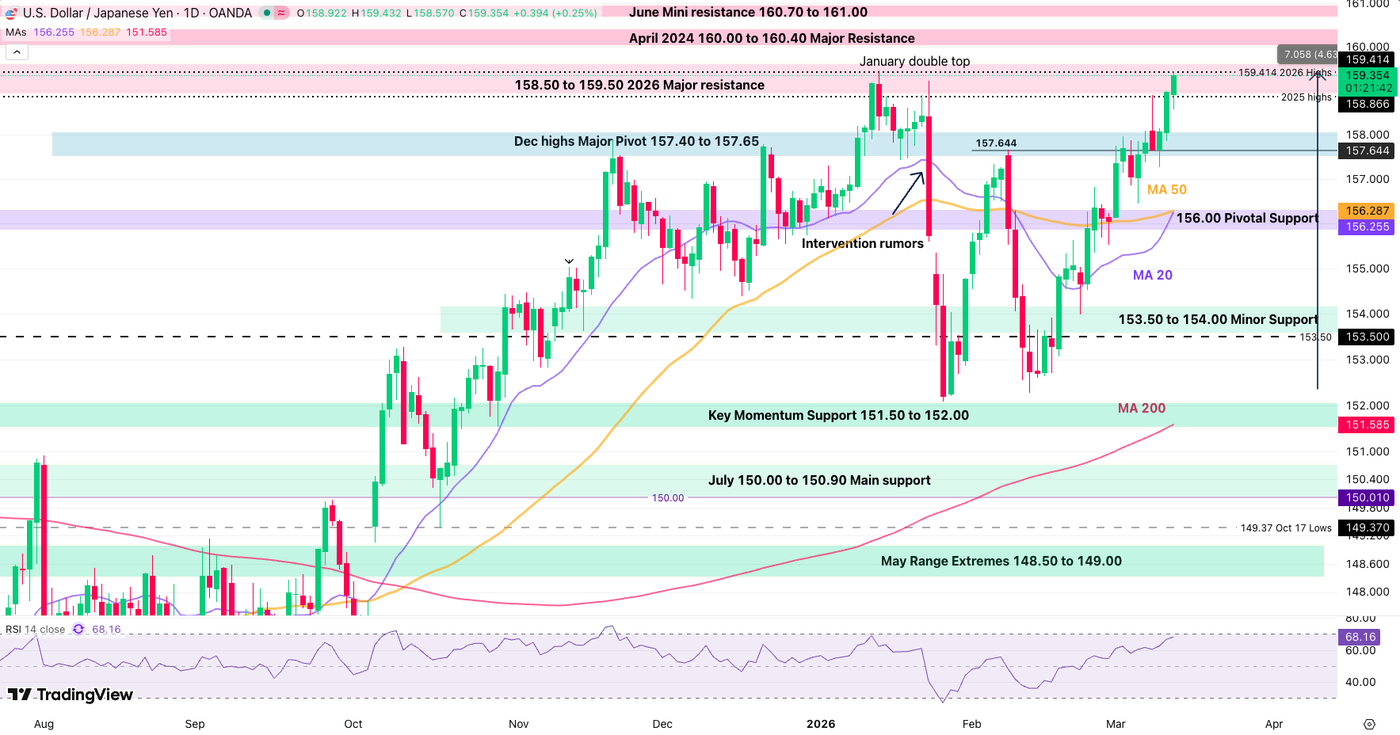
USD/JPY has been the most affected major pair since the beginning of the conflict, holding an almost perfectly negative correlation to the Oil prices.
Asian countries are the major victims of Strait of Hormuz disruptions, particularly concerning Oil deliveries.
Despite Japan having some of the most ample strategic Oil reserves, Yen was already facing some heavy scrutiny regarding heavy imports and their more elevated costs.
The effect of higher forecasted deficits doesn’t help.
So if the Hormuz Crisis lasts longer, it could be a final nail in the coffin for the pair.
Furthermore, the Japanese Yen is highly correlated to US Treasuries, which have been getting ransacked from the higher inflation expectations due to Japan being the nº1 owner of the Debt asset. The combination of both has led to the current 4.60% move higher in the major pair.
160.00 is the level to watch, as the Ministry of Finance could really move the pin on the numerous threats of an FX intervention – Watch reactions as we regain the January highs.
USD/JPY 1H Chart and Technical Levels
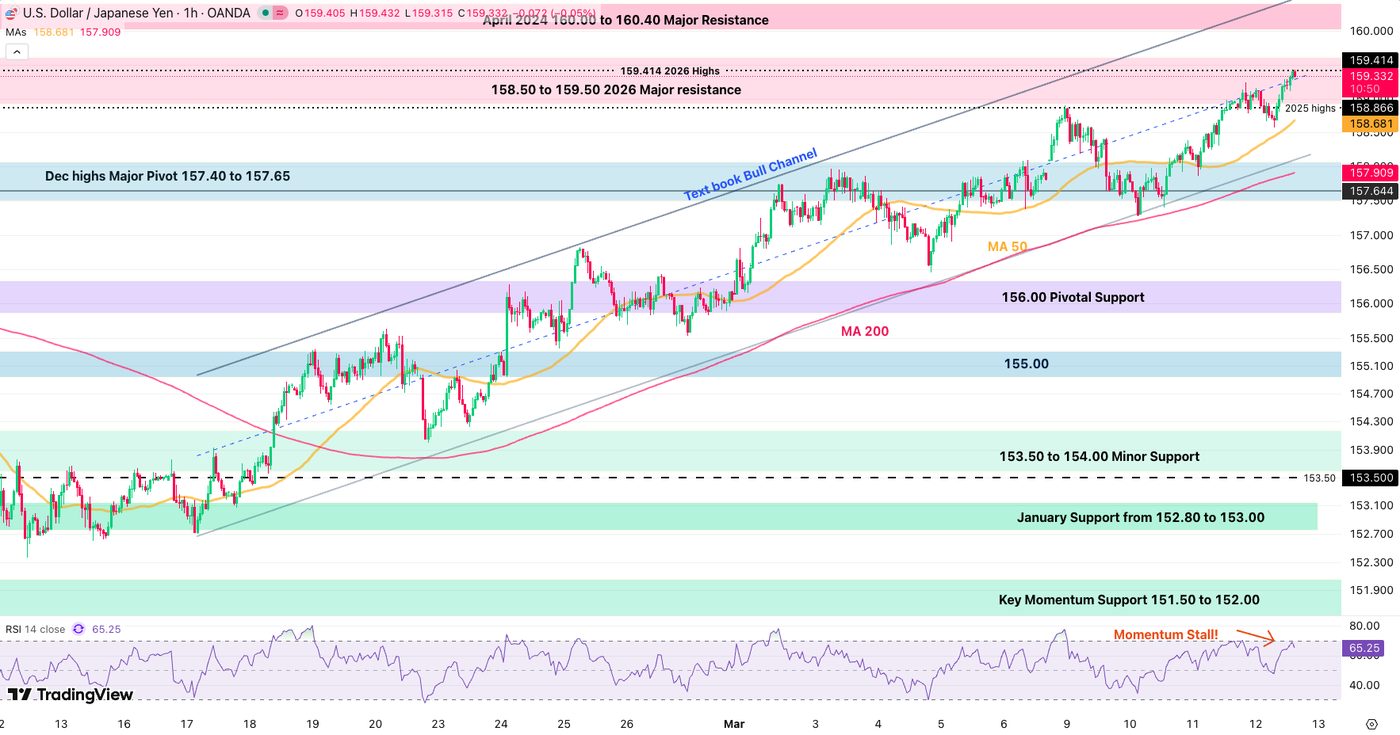
Despite the staggering run in the pair, some profit taking is unrolling just after the pair wicked above January highs to 159.420.
Reversing around the mid-line of the textbook bull channel, particularly at current trading levels could bring interesting mean-reversion opportunities.
If the pair continues back above 159.50 and makes a 4H close above, the idea would get pushed back until 160.00, with potential intervention coming up at these levels.
Levels to place on your USD/JPY charts:
Support Levels:
- Bull Channel Lows 158.10
- Dec highs Major Pivot 157.40 to 157.65
- 156.00 Pivotal Support
- 153.50 to 154.00 Minor Support
- 146.00 August Range Main Support
Resistance Levels:
- Daily and 2026 highs 159.420
- 159.00 to 159.50 2026 Major resistance
- April 2024 160.00 to 160.40 Major Resistance
- June 2024 Mini resistance 160.70 to 161.00
Opinions are the authors’; not necessarily that of OANDA Business Information & Services, Inc. or any of its affiliates, subsidiaries, officers or directors. The provided publication is for informational and educational purposes only.
If you would like to reproduce or redistribute any of the content found on MarketPulse, an award winning forex, commodities and global indices analysis and news site service produced by OANDA Business Information & Services, Inc., please refer to the MarketPulse Terms of Use.
Visit https://www.marketpulse.com/ to find out more about the beat of the global markets.
© 2026 OANDA Business Information & Services Inc.
#USD #extends #lead #Fed #cuts #price #USDJPY #cycle #highs