

Here’s another example of the deep lack of affordability in California housing: Just one in eight homes for sale in the state’s six largest metropolitan areas look “affordable” to typical local incomes.
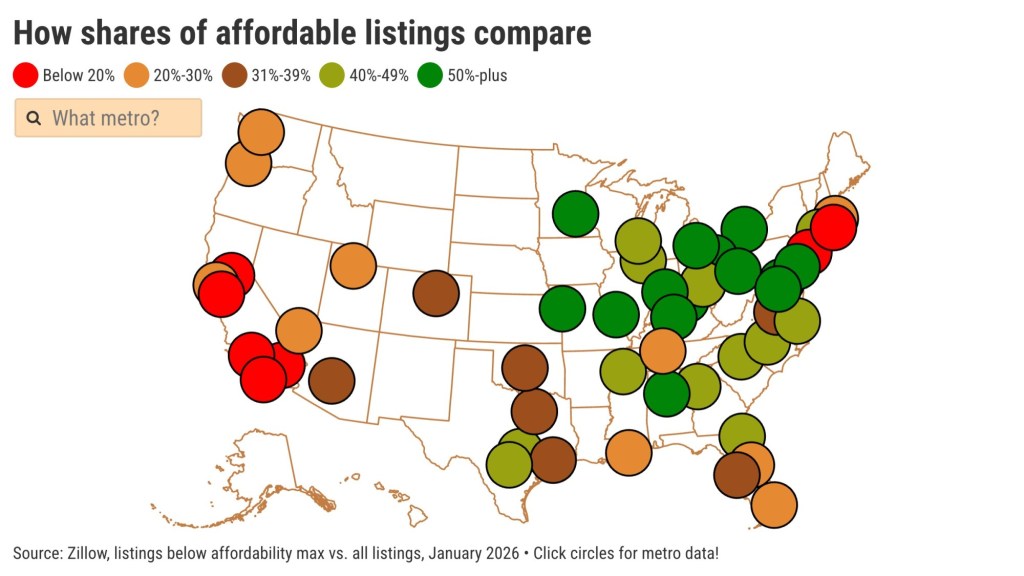
My trusty spreadsheet reviewed Zillow statistics on pricing and inventory, comparing a house hunter’s theoretical buying power with the number of homes listed for sale in January in 50 big U.S. metro areas, including six from California. Zillow’s affordability target price is based on house payments — excluding taxes and insurance and assuming a 20% down payment — that equal 30% of the local median income.
In the state’s largest housing markets combined, only 6,341 of 51,803 listings were priced below a combined affordability maximum of $415,600.
That’s just 12%.
The only good news is that this shamefully meager level of affordability is up from 8% at the start of 2025. Cheaper mortgage rates and incomes outpacing home appreciation helped to improve a house hunter’s hopes.
Ugly truth
But just how horrible is 12%?
Consider the 44 metros studied outside of the Golden State.
Collectively, 38% of homes for sale were affordable – 187,364 of 487,796 listings below the $346,400 affordability max. In January 2025, it was 31%.
Or contemplate what house hunters are seeing in the rest of the nation, minus the big 50 metros.
In what I’ll call “small town America,” 40% of listings are financially attainable – 253,277 of 570,487 below the $331,500 affordability max. That was up from 35% one year ago.
Look at the Golden State housing mess another way: 5% of the nation’s listings were in the six big California markets, but the state accounted for only 1% of the homes on the market that met Zillow’s affordability standards.
Locally speaking
Another painful spin: The six California metros were among the 10 worst for affordability in the 50 markets studied.
Los Angeles-Orange County’s affordability was the lowest in the nation.
Only 6% of the homes for sale – 1,107 of 19,507 listings – met the $421,000 affordability threshold, ranking 10th among the 50 large metros studied. In January 2025, the affordable share of listings was 2%, also the worst in the nation.
The other five California markets, and their lowly ranking for affordability:
– No. 2 worst, San Diego: 11% affordable – 675 of 5,969 listings below its $477,600 affordability standard – No. 5 highest among the 50. A year ago? 6%.
– No. 4 worst, Inland Empire: 16% affordable – 2,365 of 14,892 listings below $383,600 standard – No. 17 highest. A year ago? 11%.
– No. 6 worst, Sacramento: 17% affordable – 766 of 4,523 listings below $414,900 standard – No. 11 highest. A year ago? 11%.
– No. 7 worst, San Jose: 18% affordable – 309 of 1,710 listings below $741,700 standard – nation’s highest. A year ago? 12%.
– No. 10 worst, San Francisco: 22% affordable – 1,119 of 5,202 listings below $581,600 standard – No. 2 highest. A year ago? 17%.
Jonathan Lansner is the business columnist for the Southern California News Group. He can be reached at jlansner@scng.com
- Try Jonathan Lansner’s Substack collection of economic trends. CLICK HERE!
#California #house #hunters #afford #homes #sale #East #Bay #Times