

- Markets are rallying due to the finalization of the Peace Memorandum, but final agreement by Trump and Khamenei are still awaited
- While Nasdaq continues to price heaven and shoot for it, the DJIA is surprisingly unchanged
- Exploring Technical Levels for the Dow Jones, Nasdaq and S&P 500
Stock Markets are rallying after major diplomatic progress, as negotiators have finalized the draft of the much-anticipated US-Iran Peace Memorandum. Still, the deal is not yet official.
Axios reports that while the main framework is set, final approval is needed from both President Trump, who has asked for a few more days to review the terms, and Supreme Leader Khamenei, before the agreement is signed.
The draft shows a more balanced agreement, still tilting towards the US. The main points include keeping the Strait of Hormuz open and gradually lifting the US naval blockade over the next 30 days.
The draft also calls for Iran to get rid of its highly enriched nuclear material and allows for free commercial transit in the region.
In return, Iran will have key financial assets unfrozen, some economic sanctions lifted, and new systems set up for more humanitarian aid.
Even with this major diplomatic breakthrough, energy markets are reacting quietly today. WTI Crude Oil is almost unchanged and remains below $90 as traders wait for clear signs that the strait will reopen. Brent crude fell sharply and is now trading close to WTI, as the international risk premium has disappeared.

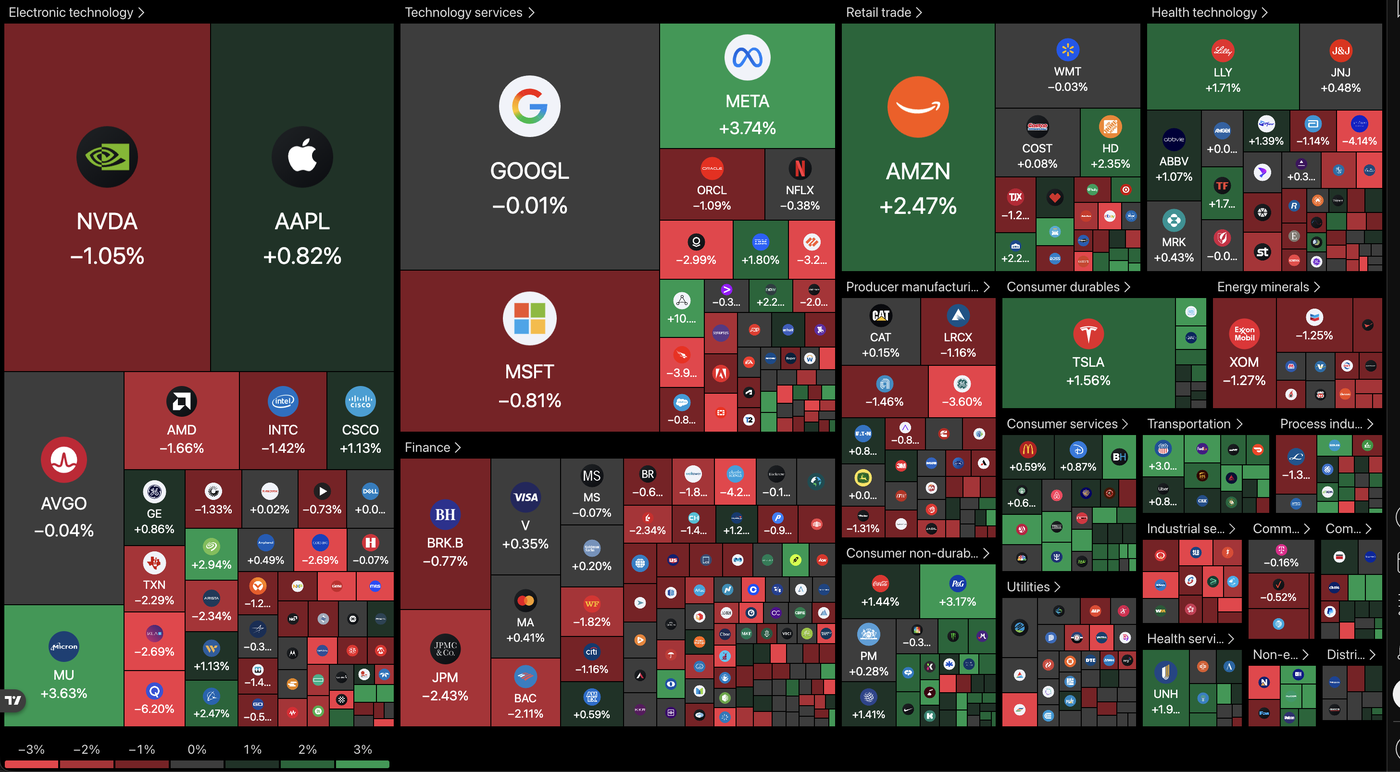
The tech-focused Nasdaq is rising quickly, led by gains in semiconductor and large tech companies, running for yet another all-time high, but the rise isn’t uniform, with the Dow Jones Industrial Average mostly flat.
Outside of the tech sector, most of the market is quiet, as big investors wait for the final diplomatic approvals by the respective US and Iran leaders.
Now, let’s take a look at the intraday charts and trading levels for the Dow Jones Industrial Average, Nasdaq Composite, and S&P 500.
Discover:
- Chart alert: Gold (XAU/USD) bearish breakdown below 200-day MA, further potential weakness ahead
- Asia open: AI Capex mania fuels world stocks to all-time highs as US-Iran peace deal skepticism lingers
- Traders are desperate for more news, but the status quo is positive
Current Session’s Stock Heatmap
Dow Jones 4H Chart and Trading Levels
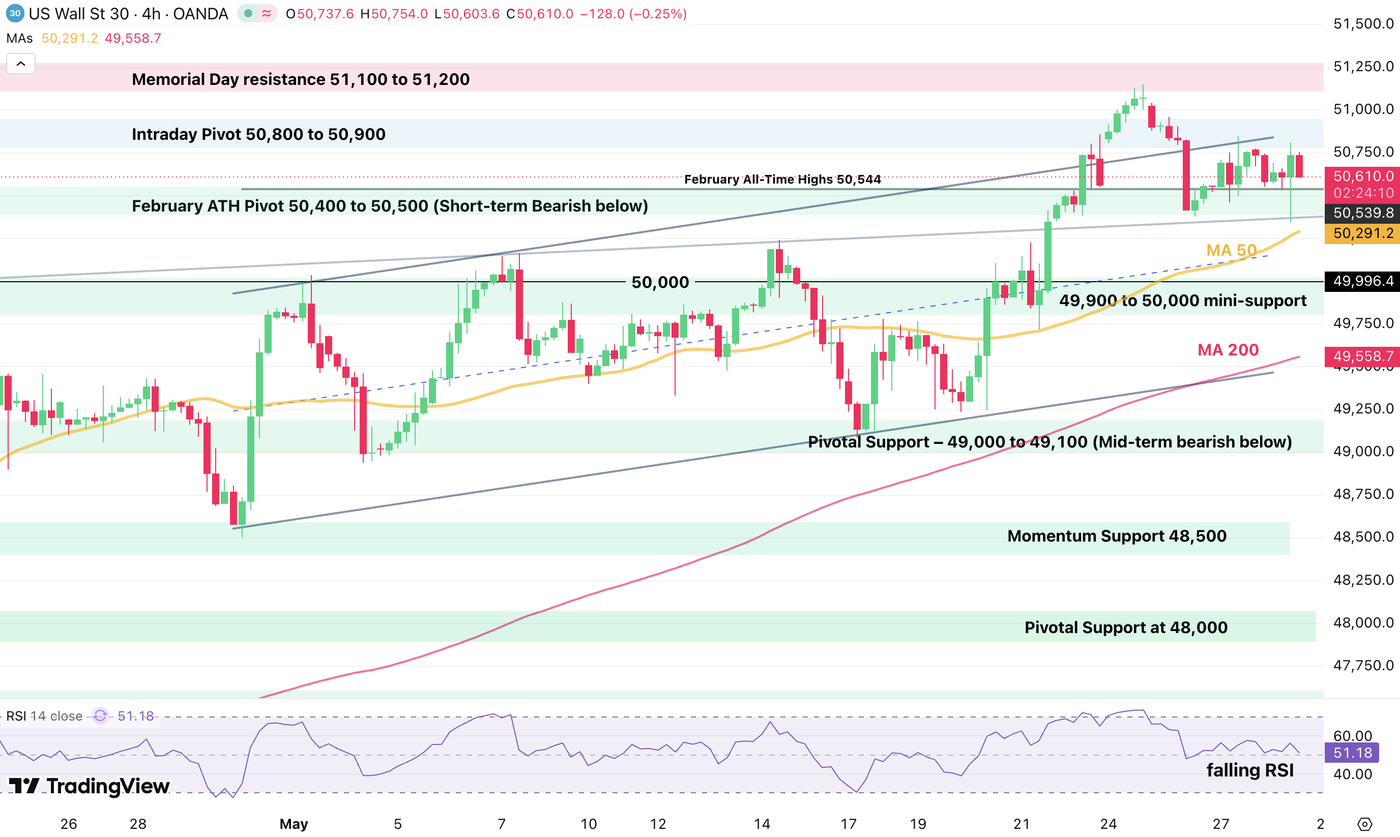
Bulls are actually struggling to push the DJIA above the 50,750 major momentum pivot, despite a strong morning candle.
This indicates a potential for a wider pullback, particularly if sellers push the action below the 4H 50-period MA (50,291).
Dow Jones technical levels for trading:
Resistance Levels
- Intraday Pivot 50,750 to 50,900 (morning highs)
- Memorial Day resistance 51,100 to 51,200
Support Levels
- February ATH Pivot 50,400 to 50,500 (Short-term Bearish below)
- Pivotal Support – 49,000 to 49,100 (mid-term bearish below)
- Momentum Support 48,500
- Pivotal Support at 48,000
- Mini Support 47,400 to 47,600
Nasdaq 4H Chart and Trading Levels

Nasdaq is attempting a run to new record highs but the action is stalling as we speak right around the previous 30,300 ATH.
Forming a bearish divergence, bulls will actually want to see a clean break in order to push for more price discovery – A rejection however would lead to at least a 29,535 retest (4H 50-Period MA)
Nasdaq technical levels of interest:
Resistance Levels
- 30,300 Daily Top and ATH
- Current ATH 30,327 on the CFD
Support Levels
- 29,535 retest (4H 50-Period MA)
- 29,500 – 29,650 Pivot
- 29,100 – 29,250 momentum support (short-term bearish below)
- 28,000 minor support
- Prior ATH Support 26,200 to 26,300
S&P 500 4H Chart and Trading Levels

The S&P 500 is actually the only index reaching new record highs in today’s session, but also forming a bearish divergence at the same time.
This indicates that despite the new record, momentum is not as strong as indicated – This could precede a larger pullback to 7,500.
If the bullish action continues however, 7,600 is the next step.
S&P 500 technical levels of interest:
Resistance Levels
- 7,550 – 5,770 Memorial Day ATH Resistance (double top!)
- current ATH 7,575
Support Levels
- 7,525 Past week’s ATH Resistance now pivot
- 7,450 – 7,460 Minor Support (Short-term bearish below – 4H 50-period MA (7,448)
- 7,400 Key support
- Pivotal Support 7,250 to 7,260
- Prior ATH Pivot 7,000 to 7,020
Keep track of WTI Crude and the latest headlines throughout the week to stay ahead of the game.
These are my final pieces on MarketPulse, so thank you for all who enjoyed the posts since a bit more than a year – I wish you success in the World of Trading and a long life in Markets.
Don’t forget to follow me on X (link below), send me messages for any questions and you can check out my website if you want to stay in contact.
Safe Trades!
Follow Elior on Twitter/X for Additional Market News, interactions and Insights @EliorManier
Opinions are the authors’; not necessarily that of OANDA Business Information & Services, Inc. or any of its affiliates, subsidiaries, officers or directors. The provided publication is for informational and educational purposes only.
If you would like to reproduce or redistribute any of the content found on MarketPulse, an award winning forex, commodities and global indices analysis and news site service produced by OANDA Business Information & Services, Inc., please refer to the MarketPulse Terms of Use.
Visit https://www.marketpulse.com/ to find out more about the beat of the global markets.
© 2026 OANDA Business Information & Services Inc.
#Memorandum #finalized #agreement #pending #Dow #Jones #Nasdaq #SampP #Intraday #Levels