

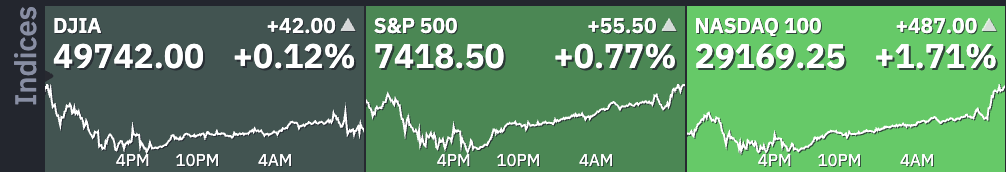
- US Stock Benchmarks rise but show mixed reactions to the confirmation of Kevin Warsh to become the next Fed Chair
- Nasdaq and S&P 500 continue to explode to new all-time highs, while the Dow Jones still struggles
- Exploring Technical Levels for the Dow Jones, Nasdaq and S&P 500
After a long and uncertain process, the Senate has confirmed that Kevin Warsh will officially replace Jerome Powell as the head of the Federal Reserve for a four-year term.
Although he has not served on the Federal Reserve board since 2011, the new Fed Chair has stayed close to economics and finance as a partner at Stanley Druckenmiller’s family office, which is one of the world’s top-performing hedge funds.
US stock benchmarks are mostly rising after the news, but the market’s reaction to Warsh’s confirmation is mixed.
The tech-heavy Nasdaq continues to jump to new all-time highs, signalling a welcome change and benefiting from strong momentum in growth stocks.
In contrast, the Dow Jones Industrial Average is still struggling, as blue-chip investors try to figure out how a Fed led by Warsh will address persistent inflation and ongoing global challenges.
Overall, the reaction across different asset classes shows that Participants are feeling uncertain.
Both the US Dollar and Precious metals are still rising, building on their strong weekly gains as investors look for cover their bearish positions in the asset class, while, cryptocurrencies and US Treasuries continue to struggle.
The Market division shows that the market is still unsure about the new Fed Chair’s approach – hence, traders will have to assess his views at the coming FOMC meeting on June 17.
Explore the different reactions in Stock Markets by diving into intraday charts and trading levels for the Dow Jones Industrial Average, Nasdaq Composite, and S&P 500.
Discover:
- Inflation is buoyant and Trump lands in China – North American Mid-Week Market Update
- Chart alert: Nasdaq 100 faces pullback risk as semiconductor rally shows signs of exhaustion
- Gold (XAU/USD) rises slow and steady – In-depth Gold technical analysis
Current Session’s Stock Heatmap
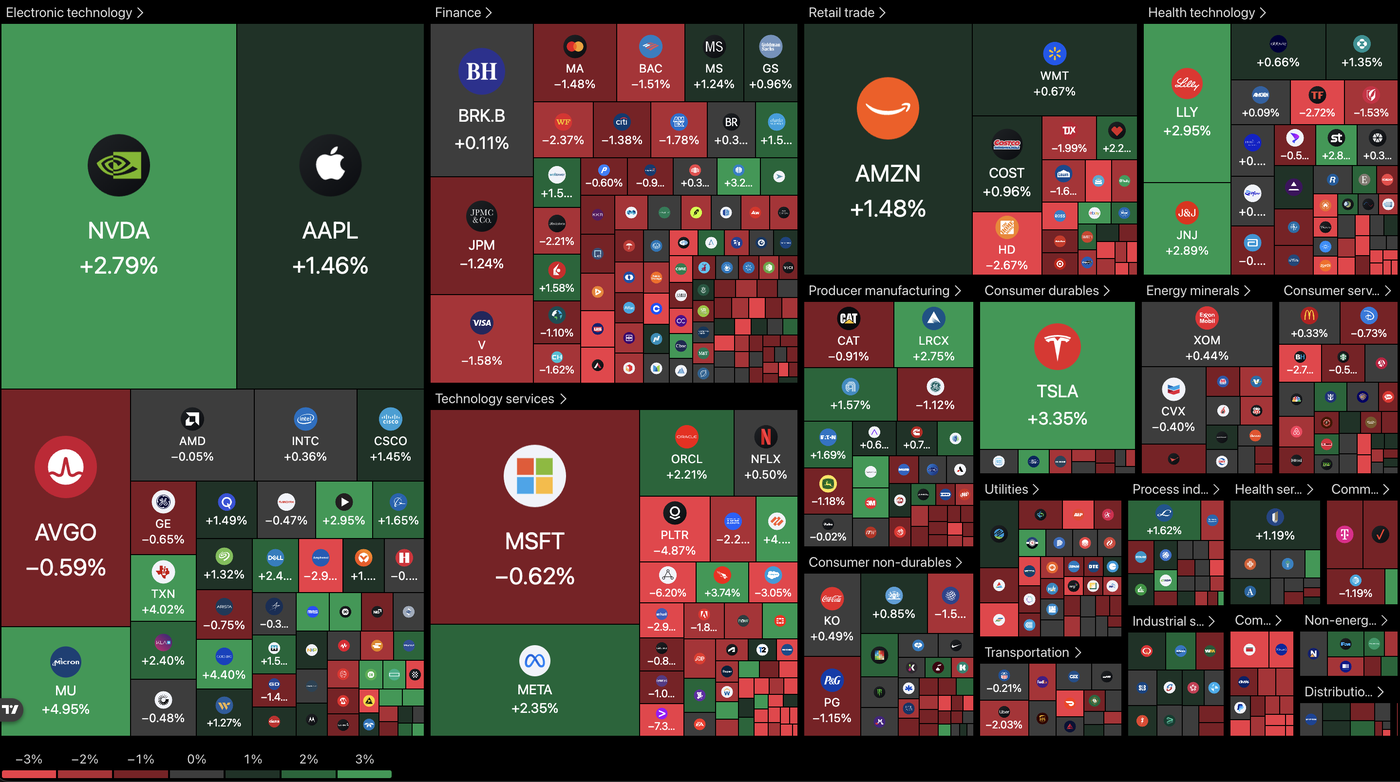
The Stock Market heatmap is still heavily fractured – Stock Market leaders like Nvidia, Tesla, Eli Lilly and a few semiconductors are doing the heavy lifting while other names largely struggle and the AI boom continues to bulldoze the Nasdaq to new records.
Dow Jones 1H Chart and Trading Levels
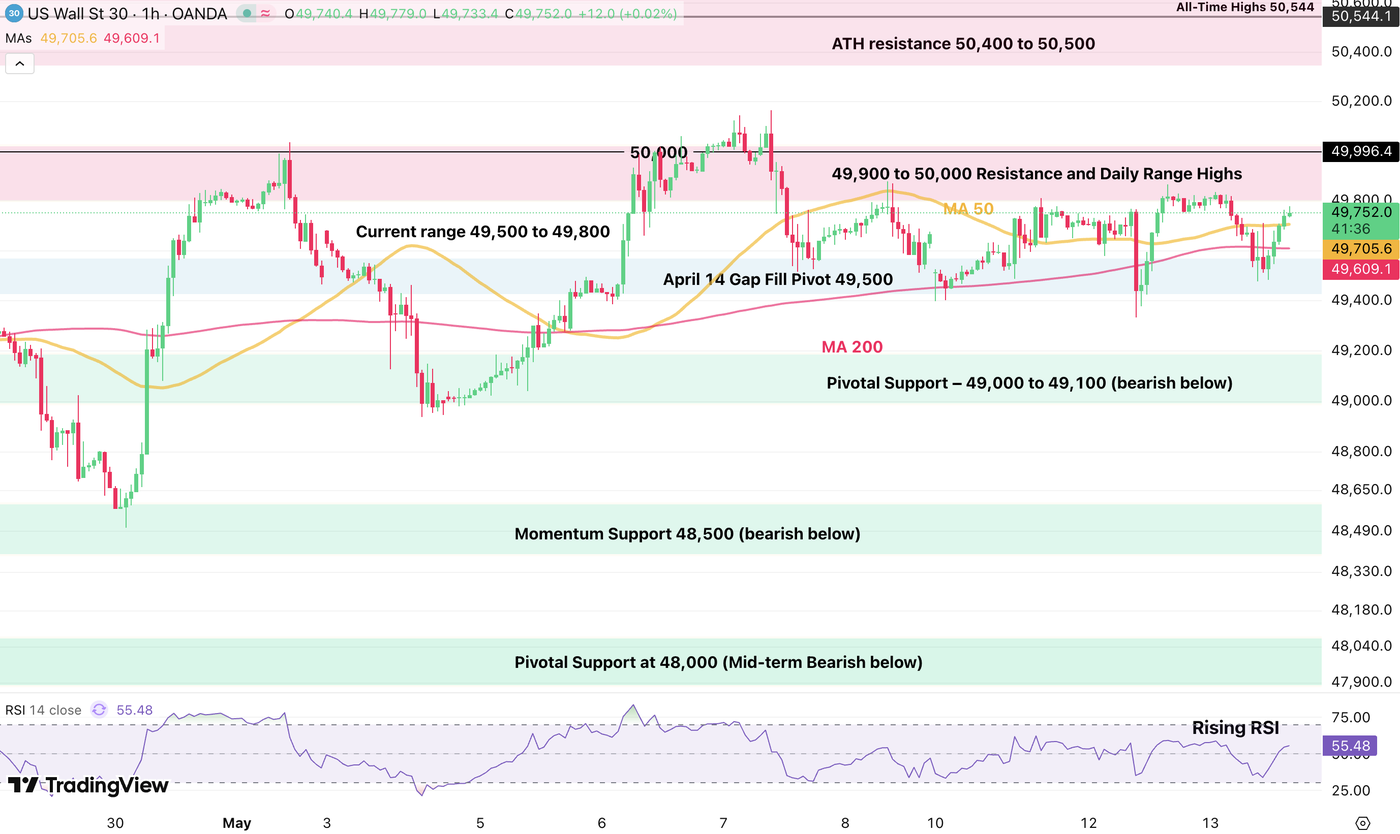
After initial struggles, the Dow Jones is rallying back to the top of its tighter consolidation between 49,500 and 49,800, which provides further strength of support and resistance levels.
For an upside breakout, look for a 1H candle break on high volume above 49,800 – the confirmation comes on a close above 50,000.
On the other hand, bears will want to see a break below 49,500 and a longer-run pullback below 49,000.
Dow Jones technical levels for trading:
Resistance Levels
- 49,780 post-Warsh confirmation highs
- 49,900 to 50,000 Resistance and Early 2026 Highs (range highs)
- ATH resistance 50,400 to 50,500
- All-Time Highs 50,544
Support Levels
- April 14 Gap Fill Pivot 49,500 (mini range lows – short-term bearish below))
- Major Pivot – 49,000 to 49,100 (mid-term bearish below)
- Momentum Support 48,500
- Pivotal Support at 48,000
- Mini Support 47,400 to 47,600
Nasdaq 1H Chart and Trading Levels
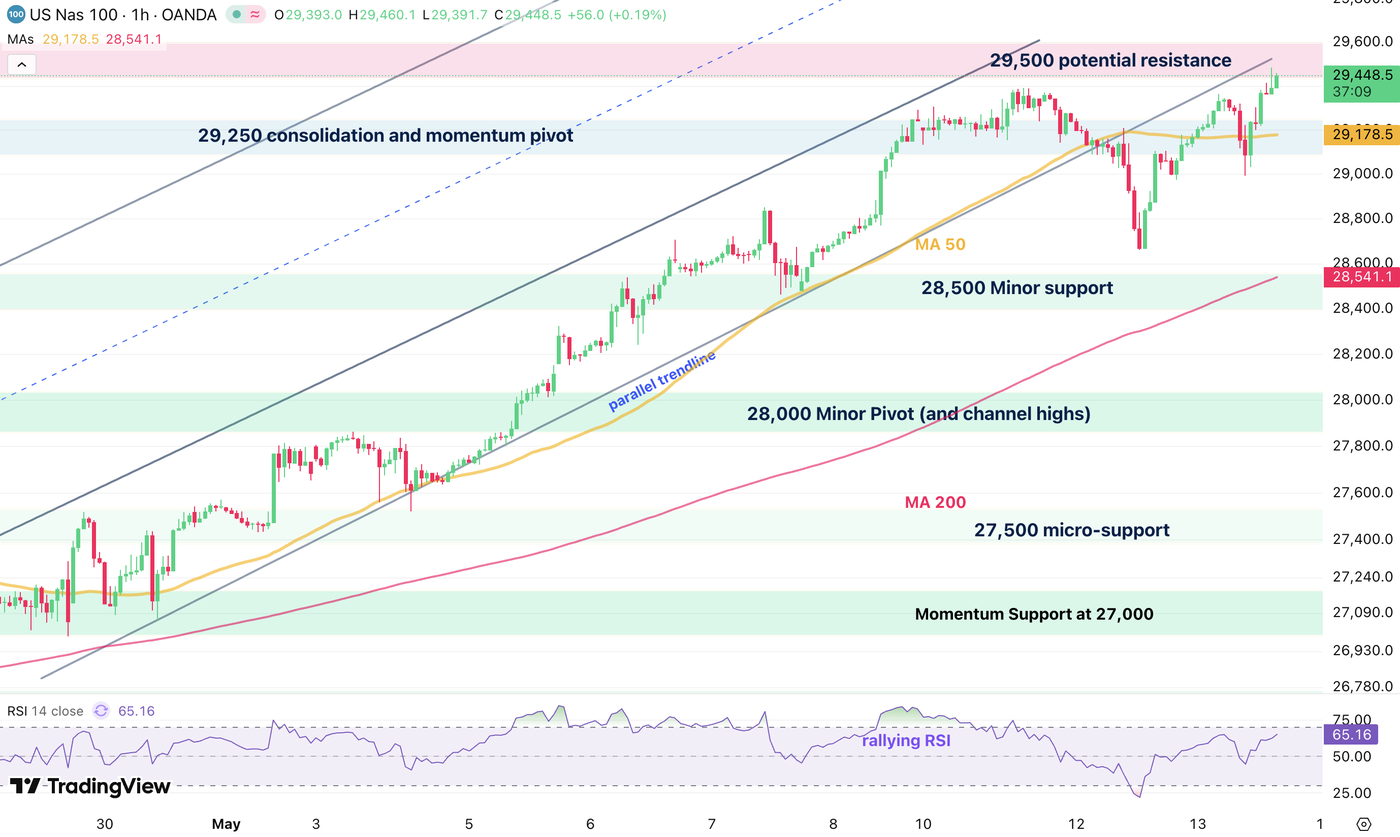
Despite the record highs reached in today’s session, led by a gigantic rebound after yesterday’s rough correction, the immediate highs aren’t so optimistic.
Indeed, the new record is stalling right above the previous record, a price action that hints at stop chasing rather than a continuous rise – Still, the previous rally hints at decent potential for upside, but to confirm, the index will have to print above 29,600.
On the other hand, if the action falls below the 50-Hour MA (29,160), the action may get dire.
Nasdaq technical levels of interest:
Resistance Levels
- 29,485 morning highs
- Next level 29,600 (Short-term bullish above)
Support Levels
- 50-Hour MA (29,160) (ST bearish below)
- 28,500 short-term pivot
- 28,000 Major psychological resistance now Pivot (and channel highs)
- Momentum Pivot at 27,000 (4H 50-period MA)
- Mini-support 26,600 to 26,750
- Prior ATH Support 26,200 to 26,300
S&P 500 2H Chart and Trading Levels
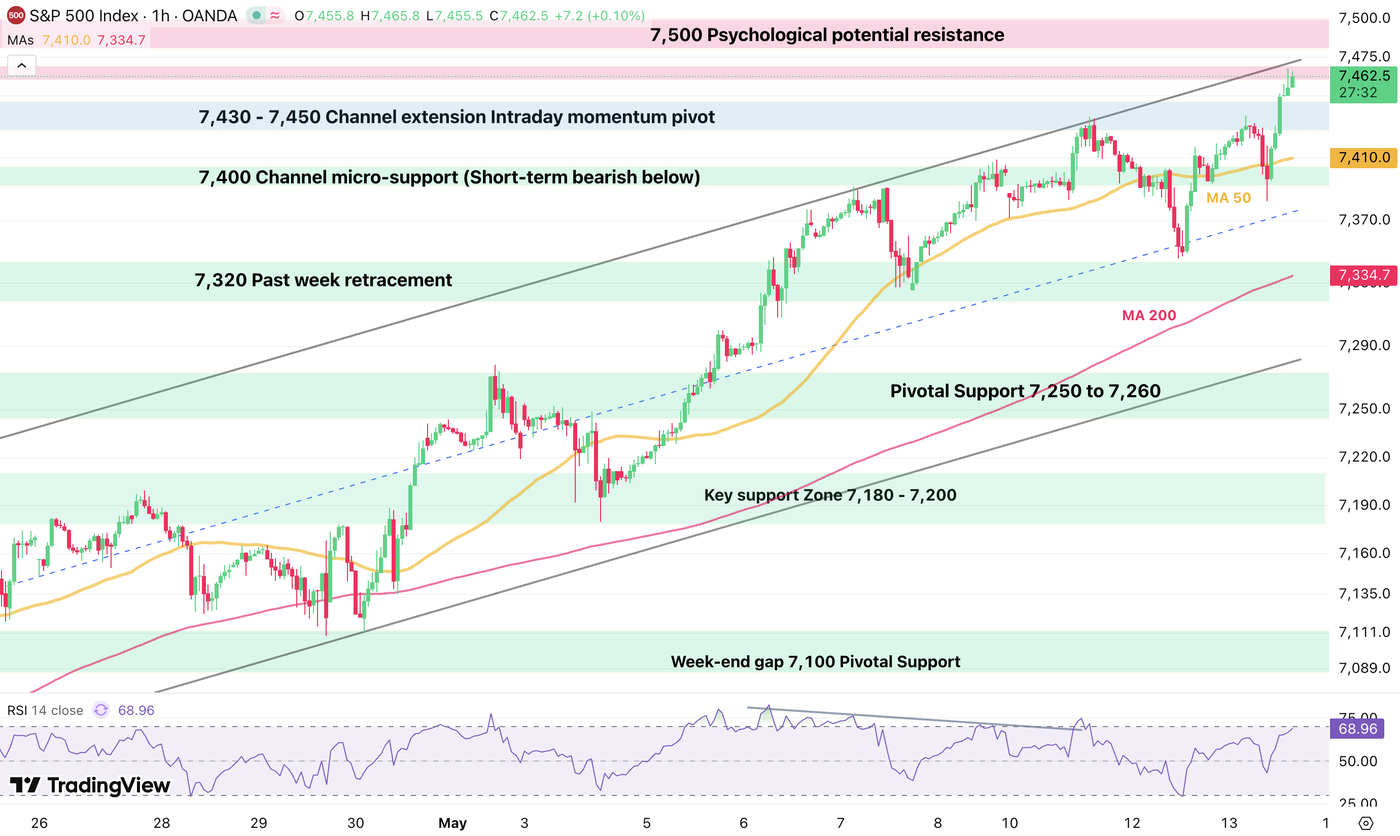
The S&P 500 is continuously following the higher part of its bull channel, helping a consistent bounce to new all-time highs – The Index is showing the strongest intraday price action out of the 3 major US Benchmarks.
As long as the action remains above the Channel’s mid-line 7,375, expect the rally to persistent records to continue.
S&P 500 technical levels of interest:
Resistance Levels
- 7,390 – 7,400 Channel extension resistance (morning highs)
- 7,415 161.% Fib
- Next stop 7,480
Support Levels
- Momentum Pivot 7,250 to 7,260
- Channel lows 7,230 (bearish below)
- 7,100 psychological level
- Prior ATH Pivot 7,000 to 7,020
- Minor Support 6,880 to 6,900
- Pivotal Support 6,750 to 6,770
- 6,300 psychological level (War lows)
Keep track of WTI Crude and the latest headlines throughout the week to stay ahead of the game.
Safe Trades!
Follow Elior on Twitter/X for Additional Market News, interactions and Insights @EliorManier
Opinions are the authors’; not necessarily that of OANDA Business Information & Services, Inc. or any of its affiliates, subsidiaries, officers or directors. The provided publication is for informational and educational purposes only.
If you would like to reproduce or redistribute any of the content found on MarketPulse, an award winning forex, commodities and global indices analysis and news site service produced by OANDA Business Information & Services, Inc., please refer to the MarketPulse Terms of Use.
Visit https://www.marketpulse.com/ to find out more about the beat of the global markets.
© 2026 OANDA Business Information & Services Inc.
#Kevin #Warsh #confirmed #Fed #Chairman #Reactions #Dow #Jones #Nasdaq #amp #SampP